





AS OF 10:15 A.M. CENTRAL — TUESDAY, NOVEMBER 3, 2026
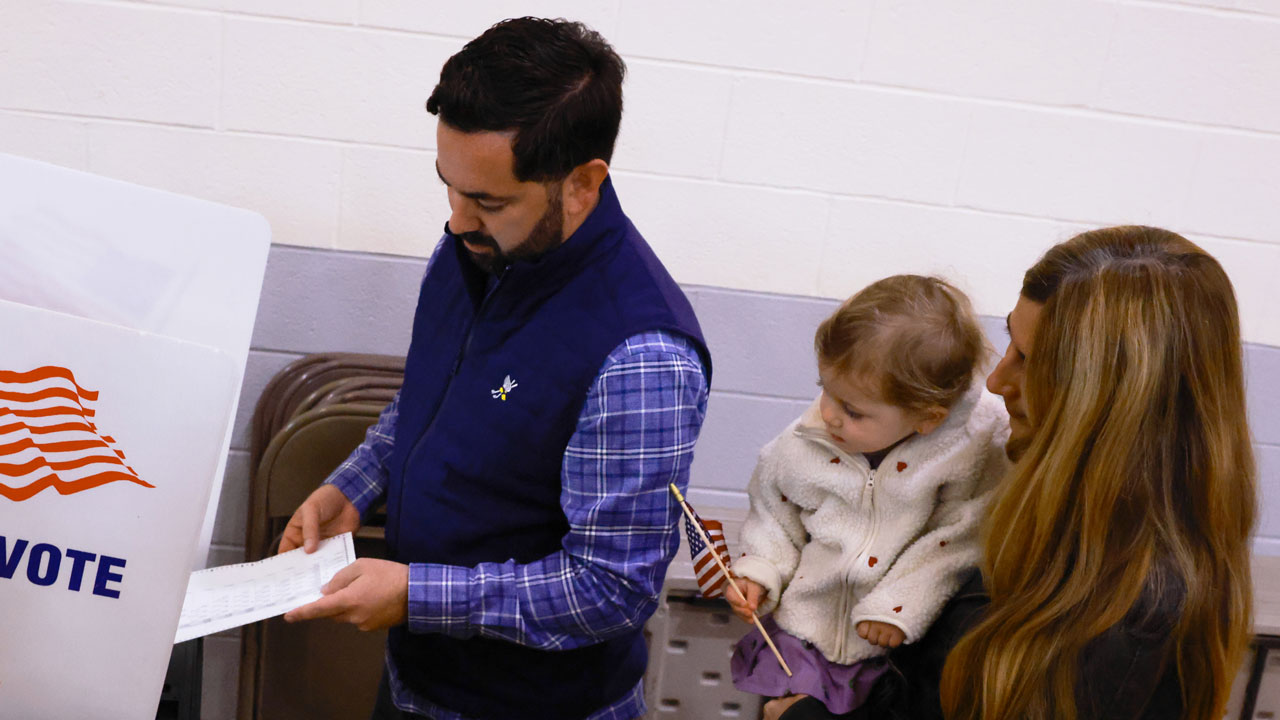
Election Day voting is underway, and the battle for control of Congress has entered its final stage.
Here is the straight answer one hour after our first morning update: no congressional vote totals are reporting, no credible national exit poll has been released, and no House or Senate race has been called.
That means every candidate number below is still a final pre-election poll — not a vote result.
The material change since the 9:15 a.m. Central edition is not a scoreboard change. There is none.
The Associated Press has opened its live Election Day report and sharpened the control stakes as voting continues, while every major race in this update remains uncalled with zero reported votes.
AP’s morning file highlights Texas, Michigan, and Iowa as central Senate tests and notes that mid-decade redistricting changed roughly one-third of House districts without clearly moving the national map toward either party. It also identifies the consequences of a chamber flip: House control brings committee gavels and subpoena power, while Senate control determines whether President Trump can continue moving judicial and executive nominees.
The report describes Iowa’s Senate and governor contests as simultaneously open for the first time since 1968 and points to Texas as the Democrats’ largest Senate bid there in decades. Those are Election Day stakes and race context, not declared outcomes.
We also moved the Senate comparison to one unified final New York Times/Siena battleground wave. That makes the race-to-race comparison cleaner without pretending any survey has become a ballot count.
Republicans begin the day with a 53-47 Senate advantage and a 219-214 House edge, with two House vacancies. The House majority line is 218.
Republicans can control a 50-50 Senate through Vice President JD Vance’s tie-breaking vote; Democrats need 51 seats.
The Republican Senate campaign opened Election Day with a simple warning about what is at stake:
IT’S ELECTION DAY, AMERICA!
Get out, vote, and protect the Majority.
https://t.co/0ZvvxAUA6w pic.twitter.com/rSGBmjyvth
— Senate Republicans (@NRSC) November 3, 2026
PRE-ELECTION POLLING
Siena Research Institute released its final seven-state Senate wave on November 1. Democrats led in all seven contests, but Siena’s own director cautioned that many races remained within the total margin of error and that either party could still win the majority.
The official release put Democratic margins at 11 points in Michigan, seven in Texas, six in Maine, and roughly five in Kansas and Ohio. Alaska was a two-point race in Siena’s rounded topline, while Iowa was virtually tied.
Siena reported state-level sampling margins of error ranging from plus or minus 3.4 points in Texas to plus or minus 5.0 points in Alaska. That uncertainty is larger than the measured gap in Alaska and Iowa and is another reason the survey cannot be read as a result.
99 chambers lists the exact field dates, likely-voter samples, precise candidate shares, and links to the underlying releases. Those are the figures used in the race panels below.
The Alaska fieldwork ran October 23-30 with 610 likely voters. Iowa used 705 likely voters from October 26-November 1, while Kansas and Maine used 736 and 714 likely voters from October 27-November 1.
Michigan’s final sample was 1,011 likely voters over October 23-November 1. Ohio included 717 likely voters from October 26-November 1, and Texas included 1,215 likely voters from October 27-November 1.
The tracker also distinguishes poll responses from its separate forecast probabilities. Only the survey responses appear here, and no forecast has been relabeled as a vote count.
Every Senate race in this section has one status: POLLING ONLY.
ALASKA SENATE — STATUS: POLLING ONLY.
The final New York Times/Siena survey was conducted October 23-30 among 610 likely voters. Democrat Mary Peltola registered 47.6%, while Republican Sen. Dan Sullivan had 46.2% — a 1.4-point Peltola edge.
That is effectively a toss-up once the poll’s uncertainty is considered. Alaska’s ranked-choice system can also leave a close first-choice count unresolved after Election Night.
IOWA SENATE — STATUS: POLLING ONLY.
The October 26-November 1 New York Times/Siena poll of 705 likely voters put Democrat Josh Turek at 47.6% and Republican Ashley Hinson at 46.9%. Turek’s 0.7-point lead is far too small to call predictive.
Iowa is an open-seat contest, and the final survey says turnout could decide it by the narrowest of margins.
KANSAS SENATE — STATUS: POLLING ONLY.
New York Times/Siena surveyed 736 likely voters from October 27-November 1. Democrat Adam Hamilton had 49.0%, while Republican Sen. Roger Marshall had 43.9%, a 5.1-point Hamilton advantage.
For Republicans, that is one of the most alarming numbers on the board. It is still a poll in a state with a strong Republican history, not a reported result.
MAINE SENATE — STATUS: POLLING ONLY.
The final October 27-November 1 survey of 714 likely voters found Democrat Troy Jackson at 50.9% and Republican Sen. Susan Collins at 45.0%. Jackson’s measured lead was 5.9 points.
Maine uses ranked-choice voting. If no candidate wins a first-choice majority, the tabulation can continue through additional rounds.

MICHIGAN SENATE — STATUS: POLLING ONLY.
New York Times/Siena interviewed 1,011 likely voters from October 23-November 1. Democrat Abdul El-Sayed posted 52.6% to Republican Mike Rogers’ 41.6%, an 11-point advantage in the final poll.
That is the widest margin in this seven-state set. Michigan still does not release a winner because a survey showed a lead.
The votes have to be counted.
Rogers used his Election Day message to remind Michigan voters that polls are open from 7 a.m. to 8 p.m. local time:
OHIO SENATE SPECIAL — STATUS: POLLING ONLY.
The final New York Times/Siena poll ran October 26-November 1 with 717 likely voters. Democrat Sherrod Brown had 49.3%, and Republican Sen. Jon Husted had 43.7%.
Brown’s measured advantage was 5.6 points.
Ohio has produced different readings across late polls, which is exactly why no single survey can be promoted into an election result.
TEXAS SENATE — STATUS: POLLING ONLY.
The October 27-November 1 New York Times/Siena survey of 1,215 likely voters placed Democrat James Talarico at 50.2% and Republican Ken Paxton at 43.1%. That is a 7.1-point Talarico lead in the poll.
Texas has not elected a Democrat to the U.S. Senate since 1988. If Paxton closes the polling gap through Election Day turnout, the actual count will show it.
Nothing has been called.

THE HOUSE BATTLEGROUNDS
The House contest is broader and more fragmented. NPR identified 70 districts where both parties were spending at least six figures in the final stretch, including heavily contested seats in Michigan, North Carolina, New York, and Florida.
The spending reached more than $10 million per side in some toss-up districts, showing how wide the competitive map became before Election Day. NPR also found seven-figure investments reaching Republican-leaning areas in Tennessee, Oklahoma, and Arkansas.
That landscape does not mean all 70 seats are equally likely to flip. It means both parties saw enough risk or opportunity to commit serious money, while local candidates, district lines, and turnout still control each individual outcome.
The spending map is a warning system, not a tally sheet.
Pennsylvania provides one of the clearest four-seat clusters. Siena Research Institute found Democrats leading three Republican-held districts and tied in a fourth in its final New York Times/Philadelphia Inquirer surveys.
The rounded toplines placed Bob Harvie ahead 48%-46% in PA-01, Bob Brooks ahead 49%-44% in PA-07, and Paige Cognetti ahead 51%-46% in PA-08. PA-10 was rounded to a 48%-48% tie between Janelle Stelson and Scott Perry.
The precise unrounded figures show Perry ahead by 0.4 points in PA-10, while the three Democratic advantages ranged from 2.4 to 5.1 points. Each district poll was conducted October 16-22 among roughly 400 likely voters, so none supplies a result or a safe call.
All four races below remain POLLING ONLY.
PENNSYLVANIA 1ST DISTRICT — STATUS: POLLING ONLY.
The October 16-22 survey of 400 likely voters put Democrat Bob Harvie at 48.26% and Republican Rep. Brian Fitzpatrick at 45.83%. Harvie’s measured edge was 2.4 points.
PENNSYLVANIA 7TH DISTRICT — STATUS: POLLING ONLY.
Among 401 likely voters surveyed October 16-22, Democrat Bob Brooks registered 49.25%, while Republican Rep. Ryan Mackenzie had 44.15%. Brooks led by 5.1 points in the poll.
PENNSYLVANIA 8TH DISTRICT — STATUS: POLLING ONLY.
The October 16-22 poll of 402 likely voters showed Democrat Paige Cognetti at 50.53% and Republican Rep. Rob Bresnahan at 46.48%. Cognetti’s measured lead was 4.1 points.
PENNSYLVANIA 10TH DISTRICT — STATUS: POLLING ONLY.
The final district survey included 404 likely voters. Republican Rep. Scott Perry had 48.03%, and Democrat Janelle Stelson had 47.65%, giving Perry a razor-thin 0.4-point edge.
That four-district cluster shows why the House cannot be reduced to one national number. The polling environment is difficult for Republicans, but each seat has its own candidates, turnout pattern, and count.

The House Administration Committee’s Republican majority says roughly 60 Republican staff members are being deployed as official election observers across the country:
EXIT POLLS AND VOTER SURVEYS
NO CREDIBLE NATIONAL EXIT POLL OR VOTER SURVEY RESULT IS AVAILABLE YET.
No named network consortium has released usable congressional exit-poll findings at this timestamp.
Associated Press explains that the AP Voter Poll blends pre-election and in-person surveys to represent the estimated electorate. Its interviews are conducted through multiple methods and then combined after voting.
The project can produce a national reading on the generic House ballot and state-level findings where the survey is conducted. It does not produce official vote totals, and a national party preference cannot be turned into a result for a particular congressional district.
If AP releases those findings later, this article will label them as a VOTER SURVEY. They will not be silently called an exit poll.
Methodology, sample design, release time, geographic scope, and exact as-of timestamp will be shown alongside any voter-survey finding.
There is nothing responsible to chart in this section yet.
RACE PROJECTIONS / CALLS
NO HOUSE OR SENATE RACE IN THIS UPDATE HAS BEEN PROJECTED OR CALLED.
A media race call belongs in this section only. It does not become a certified final result, and it is not interchangeable with a polling lead.
Associated Press says it will call all 435 House contests and all 35 Senate races on the ballot only when its decision desk determines there is no scenario in which a trailing candidate can close the gap.
AP’s race callers use vote returns, the geography of outstanding ballots, and other election data rather than simply awarding a contest to the candidate who led the polls. A candidate declaration, campaign statement, or early lead does not satisfy that standard.
The news organization also separates a race call from the later state canvass and certification. Its own review warns that chamber control can take days when decisive contests involve slow counts, close margins, or ranked-choice tabulation.
Ranked-choice tabulation in Alaska and Maine, along with slower mail-ballot counts in several states, could push some answers beyond tonight.
CONFIRMED REPORTED RESULTS
NO CONFIRMED CONGRESSIONAL VOTE TOTALS ARE REPORTING YET.
At 10:15 a.m. Central, every major race covered above has zero reported votes, zero percent reporting, zero media calls, and zero certified final results.
Associated Press reports that the first polls close at 6 p.m. Eastern in most of Indiana and Kentucky. Georgia, South Carolina, and Virginia close at 7 p.m. Eastern, while North Carolina and Ohio close at 7:30.
Maine and Pennsylvania close at 8 p.m. Eastern. Michigan and Texas are not fully eligible for statewide calls until final polls close at 9 p.m. Eastern.
Alaska’s final polling location does not close until 1 a.m. Eastern.
AP says Georgia, South Carolina, and Virginia counted relatively quickly in 2024, while Maine took until after midnight to reach the halfway point. Kansas and Texas reached 90% counted during the midnight hour in 2024, but Michigan did not reach that level until nearly 5 a.m.
Those are historical counting guides, not promises for tonight. They explain why a morning article cannot truthfully contain congressional results and why later updates must carry an exact timestamp and reporting level.
When actual results begin, confirmed entries will include candidate vote totals, percentages, reporting levels or ballots counted, an as-of timestamp, and a named election authority or trusted results source.
HOUSE AND SENATE CONTROL DASHBOARDS
SENATE CONTROL: Pre-election baseline: 53 Republicans and 47 members of the Democratic caucus. Majority threshold: 50 for Republicans with the vice-presidential tie-break; 51 for Democrats.
2026 races called: 0. Seats currently leading from reported votes: 0.
Races uncalled: 35. Confirmed pickups: Republican 0, Democratic 0.
HOUSE CONTROL: Pre-election baseline: 219 Republicans, 214 Democrats, and two vacancies. Majority threshold: 218.
2026 races called: 0. Seats currently leading from reported votes: 0.
Races uncalled: 435. Confirmed pickups: Republican 0, Democratic 0.
No leading seat has been added to a called-seat total. There are no reported-vote leaders to count yet.

The morning verdict is blunt: Republicans are defending narrow congressional majorities in a hostile polling environment, but the country has not produced a single reported congressional result in this update.
Polling identifies the danger. Voters decide the outcome.
The count settles it.
Continue reading...
[ H/T WLT Report ]


