




From TINA To TIGA: Diversification Pays Again
Authored by Lance Roberts via RealInvestmentAdvice.com,
For more than a decade following the Financial Crisis, one acronym embodied the investment landscape: TINA, “there is no alternative.” The logic behind TINA was that the Fed and most other developed nations’ central banks held interest rates near zero and even below zero in some cases. As a result, Treasury, corporate, municipal, and international bond yields were extremely low for a decade. Thus, stocks, reasonably valued after the financial crisis, offered a clearer path to meaningful returns.

Today, TINA logic is less compelling. Risk-free 5-year and longer Treasury notes and bonds yield over 5%, and investment-grade corporate bonds yield even more. At the same time, stock valuations sit near record levels, implying weak forward returns. The acronym that best describes today’s market is TIGA, “there is a good alternative.”
Unfortunately, this article may fall on deaf ears among those looking in the rearview mirror at upward-trending equity markets and steadily falling bond prices. Although it is difficult to fight a well-established trend, such a performance divergence is usually a time to consider swimming against the current. As we show, prior peaks in the relative returns of stocks versus bonds tend to reverse quickly, but the timing of such reversals is incredibly hard to predict.
We want to emphasize that this article is not a call to sell all your stocks and replace them with bonds. It is a message that you may want to consider adjusting your investment portfolio to better manage risk while getting paid to diversify.
Before continuing, we share an apt quote from Lyn Alden:
Consider the post-2008 financial crisis backdrop:
In that very low yield environment, the choice between stocks and bonds was easy. A forward P/E for the S&P 500 of 13, as we witnessed in the years following the crisis, implies an earnings yield of nearly 8%. With the 10-year Treasury yielding at or below 2%, stocks offered nearly 6% more “yield” than bonds.
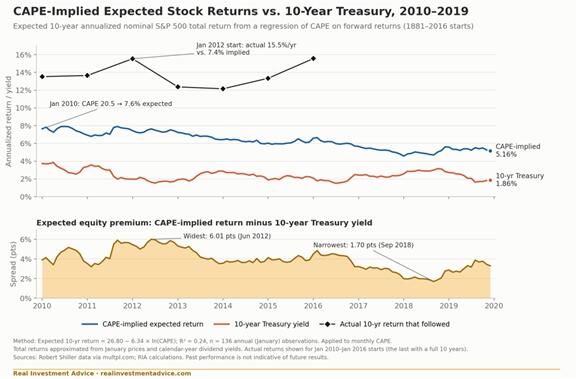
The graph below shows the implied ten-year return based on the CAPE ratio (blue), alongside the actual returns that followed (black) and the yields on a 10-year Treasury (orange). Through most of the period, the expected excess return for holding stocks over bonds ranged from 2.00% to 6.00%, while actual returns were much greater.
Investors who followed TINA were handsomely rewarded. The S&P 500 returned about 13.6% annualized during the 2010s, one of the better decades in market history. Bonds, starting from historically low yields, offered little yield and even less potential for price gains.
At the time, the relationship between stock and bond valuations made it tough, if not impossible, to argue against TINA.
The landscape has flipped over the last few years. Consider the following as of late September 2026:
Meanwhile, stock valuations are near their historical peaks:
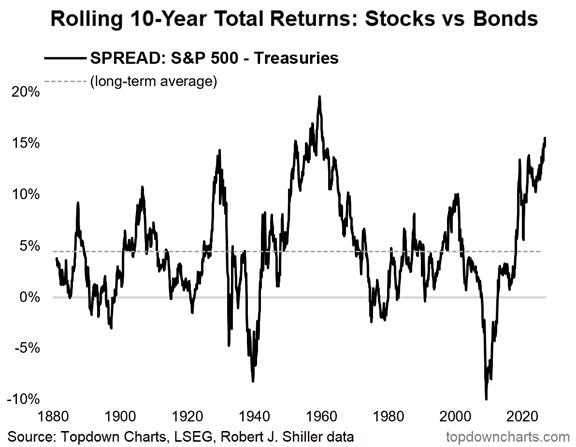
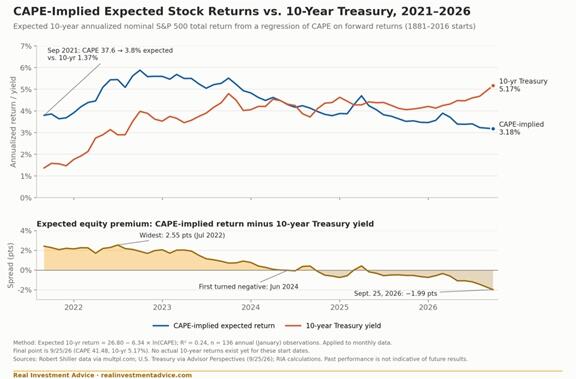
The first graph below shows that CAPE implies equity investors will underperform bonds by 2% in a buy-and-hold position over the next ten years. This contrasts with the 2% to 6% expected range we showed earlier.
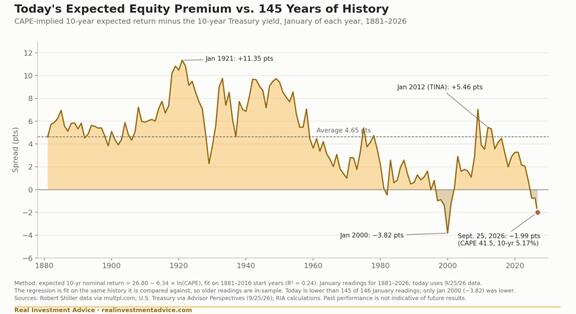
The second graph places the expected shortfall in historical context.
More telling comparisons are worth considering. For example:
Valuations are a poor timing tool, but they have proven to be a good guide to long-term returns. This makes sense: the higher the price an investor pays for a stream of earnings, the lower the return they should expect.
The dotcom boom and bust provides a clear example. The S&P 500 CAPE peaked at 44 in December 1999. Over the following decade, the S&P 500 returned approximately -0.9% annualized. Investors who bought 10-year Treasuries yielding over 6% in early 2000 fared significantly better while taking on much less risk.
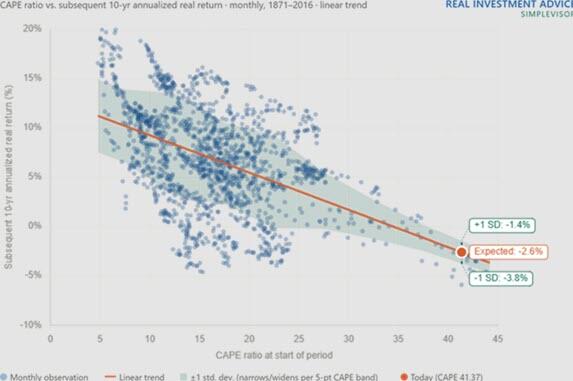
The graph below shows the real equity returns we should expect over the next ten years based on the historical relationship between CAPE and forward returns.
Bond returns, by contrast, are set in stone for investors willing to hold them to maturity.
Going forward, stock returns can certainly beat current bond yields. But for stocks to outperform, earnings growth must be strong enough to overcome elevated starting valuations and, very importantly, higher borrowing rates. That’s a much higher bar than in the early 2010s, when investors were paid handsomely to take equity risk.
We are not advocating that investors abandon equities. TIGA means there is a good alternative, and diversified portfolio decisions should reflect it. We think investors should consider taking the following steps:
TINA was the right response to a highly unusual era. Zero interest rates, negative real yields, and reasonable equity valuations made stock-centric portfolios the logical choice. Today, the relationship has been flipped on its head. Bonds yield over 5%, real yields are the highest in nearly 18 years, and stock valuations are near historic extremes. By most measures, the equity risk premium has shrunk to near zero or below.
That doesn’t mean stocks will fall or even underperform bonds. But the heightened possibility of negative returns for stocks versus bonds does mean investors should no longer feel compelled to heavily overweight stocks and forget about bonds.
For the first time in almost two decades, TIGA -there is a good alternative.
Tyler Durden Wed, 09/30/2026 - 08:05
Continue reading...
[ H/T ZeroHedge ]
Authored by Lance Roberts via RealInvestmentAdvice.com,
For more than a decade following the Financial Crisis, one acronym embodied the investment landscape: TINA, “there is no alternative.” The logic behind TINA was that the Fed and most other developed nations’ central banks held interest rates near zero and even below zero in some cases. As a result, Treasury, corporate, municipal, and international bond yields were extremely low for a decade. Thus, stocks, reasonably valued after the financial crisis, offered a clearer path to meaningful returns.
Today, TINA logic is less compelling. Risk-free 5-year and longer Treasury notes and bonds yield over 5%, and investment-grade corporate bonds yield even more. At the same time, stock valuations sit near record levels, implying weak forward returns. The acronym that best describes today’s market is TIGA, “there is a good alternative.”
Unfortunately, this article may fall on deaf ears among those looking in the rearview mirror at upward-trending equity markets and steadily falling bond prices. Although it is difficult to fight a well-established trend, such a performance divergence is usually a time to consider swimming against the current. As we show, prior peaks in the relative returns of stocks versus bonds tend to reverse quickly, but the timing of such reversals is incredibly hard to predict.
We want to emphasize that this article is not a call to sell all your stocks and replace them with bonds. It is a message that you may want to consider adjusting your investment portfolio to better manage risk while getting paid to diversify.
Before continuing, we share an apt quote from Lyn Alden:
The TINA Era: Cheap Stocks And Yield-Less Bonds
Consider the post-2008 financial crisis backdrop:
- The 10-year Treasury yield fell to 1.43% in July 2012 and ultimately bottomed at roughly 0.52% in August 2020. From 2009 through 2020, the average 10-year yield was 2.35%.
- The 10-year TIPS yield, the market’s gauge of real (inflation-adjusted) interest rates, was below zero for much of 2012 and 2013 and again in 2020 and 2021.
- The Shiller CAPE ratio troughed at 13 at the March 2009 market low and steadily rose to 32 prior to the pandemic.
- The S&P 500 forward P/E ratio traded in the low teens in 2011 through 2013.
In that very low yield environment, the choice between stocks and bonds was easy. A forward P/E for the S&P 500 of 13, as we witnessed in the years following the crisis, implies an earnings yield of nearly 8%. With the 10-year Treasury yielding at or below 2%, stocks offered nearly 6% more “yield” than bonds.
The graph below shows the implied ten-year return based on the CAPE ratio (blue), alongside the actual returns that followed (black) and the yields on a 10-year Treasury (orange). Through most of the period, the expected excess return for holding stocks over bonds ranged from 2.00% to 6.00%, while actual returns were much greater.
Investors who followed TINA were handsomely rewarded. The S&P 500 returned about 13.6% annualized during the 2010s, one of the better decades in market history. Bonds, starting from historically low yields, offered little yield and even less potential for price gains.
At the time, the relationship between stock and bond valuations made it tough, if not impossible, to argue against TINA.
Today: Expensive Stocks And Bonds With ‘Good’ Yields
The landscape has flipped over the last few years. Consider the following as of late September 2026:
- The 5- year and 10-year Treasury note yields are 5.10% and 5.25%, respectively.
- The ICE BofA US Corporate Index, a broad measure of investment-grade corporate bonds, carries an effective yield of 5.75%.
- 10- year TIPS have a real yield (after inflation) of nearly 3.00%, the highest for that maturity since October 2008.
Meanwhile, stock valuations are near their historical peaks:
- The Shiller CAPE ratio stands at 41.50, near the all-time high of approximately 44 set in December 1999 and more than two and a half times its long-term median.
- FactSet reports a forward 12-month P/E of 19.1 as of September 18. That is in line with the 10-year average of 19.0, but well above TINA-era multiples.
The first graph below shows that CAPE implies equity investors will underperform bonds by 2% in a buy-and-hold position over the next ten years. This contrasts with the 2% to 6% expected range we showed earlier.
The second graph places the expected shortfall in historical context.
The Equity Risk Premium Has Vanished
More telling comparisons are worth considering. For example:
- Forward earnings yield is equal to the 10-year Treasury yield: The current S&P 500 forward P/E of 19.1 implies an earnings yield of 5.24%, in line with the ten-year Treasury yield. Basically, investors are getting paid zero premium for owning risky stocks. In 2012, the same spread was roughly six points.
- Caution is warranted. FactSet shows analysts expect 31.8% earnings growth in 2026, boosted by large mark-to-market investment gains at Alphabet and Amazon, but only 15.2% in 2027. Both figures are well above historical averages. While the massive AI expansion could generate the forecasted growth rates and maybe more, it could also fall short, meaning the forward earnings yield is actually lower than its current level.
- CAPE earnings yield less the 10-year TIPS yield: Because CAPE uses inflation-adjusted earnings, it is best compared to real yields. The CAPE earnings yield is 2.42%, while the 10-year TIPS yield is 2.95%. Equity investors are accepting a 50 basis point negative real equity risk premium. A government-guaranteed, inflation-protected bond offers a higher real yield than the stock market’s long-run earnings power.
What High Valuations Mean For Future Returns
Valuations are a poor timing tool, but they have proven to be a good guide to long-term returns. This makes sense: the higher the price an investor pays for a stream of earnings, the lower the return they should expect.
The dotcom boom and bust provides a clear example. The S&P 500 CAPE peaked at 44 in December 1999. Over the following decade, the S&P 500 returned approximately -0.9% annualized. Investors who bought 10-year Treasuries yielding over 6% in early 2000 fared significantly better while taking on much less risk.
The graph below shows the real equity returns we should expect over the next ten years based on the historical relationship between CAPE and forward returns.
Bond returns, by contrast, are set in stone for investors willing to hold them to maturity.
Going forward, stock returns can certainly beat current bond yields. But for stocks to outperform, earnings growth must be strong enough to overcome elevated starting valuations and, very importantly, higher borrowing rates. That’s a much higher bar than in the early 2010s, when investors were paid handsomely to take equity risk.
TIGA Doesn’t Mean Sell Equities
We are not advocating that investors abandon equities. TIGA means there is a good alternative, and diversified portfolio decisions should reflect it. We think investors should consider taking the following steps:
- Rebalance toward targets. Years of equity outperformance have likely left many portfolios overweight stocks relative to their intended allocation.
- Revisit the role of bonds. Bonds can once again produce meaningful income and serve as a counterweight to equity risk.
- Match risk to time horizon. Investors with defined income needs can lock in 5%-plus yields and reduce their reliance on more volatile stocks.
Summary
TINA was the right response to a highly unusual era. Zero interest rates, negative real yields, and reasonable equity valuations made stock-centric portfolios the logical choice. Today, the relationship has been flipped on its head. Bonds yield over 5%, real yields are the highest in nearly 18 years, and stock valuations are near historic extremes. By most measures, the equity risk premium has shrunk to near zero or below.
That doesn’t mean stocks will fall or even underperform bonds. But the heightened possibility of negative returns for stocks versus bonds does mean investors should no longer feel compelled to heavily overweight stocks and forget about bonds.
For the first time in almost two decades, TIGA -there is a good alternative.
Tyler Durden Wed, 09/30/2026 - 08:05
Continue reading...
[ H/T ZeroHedge ]