





Market Warning Signs And The 'Perfect' Hedge
Via Crescat Capital,
We showed in prior letters that the US stock market has recently reached all-time high valuations across a variety of dimensions. Now, the market is flashing warning signals of a potential major market top based on a variety of divergent technical and cross-market indicators.
We show four of these in this letter:
New 52-week Highs vs. Lows Chart
Normally, when a stock market index moves up and down, the underlying stocks reaching new 52-week highs minus those hitting new 52-week lows go up and down, in sync. One can see that relationship most of the time in the NASDAQ Composite chart below over the last year. Recently, however, it’s been the opposite.
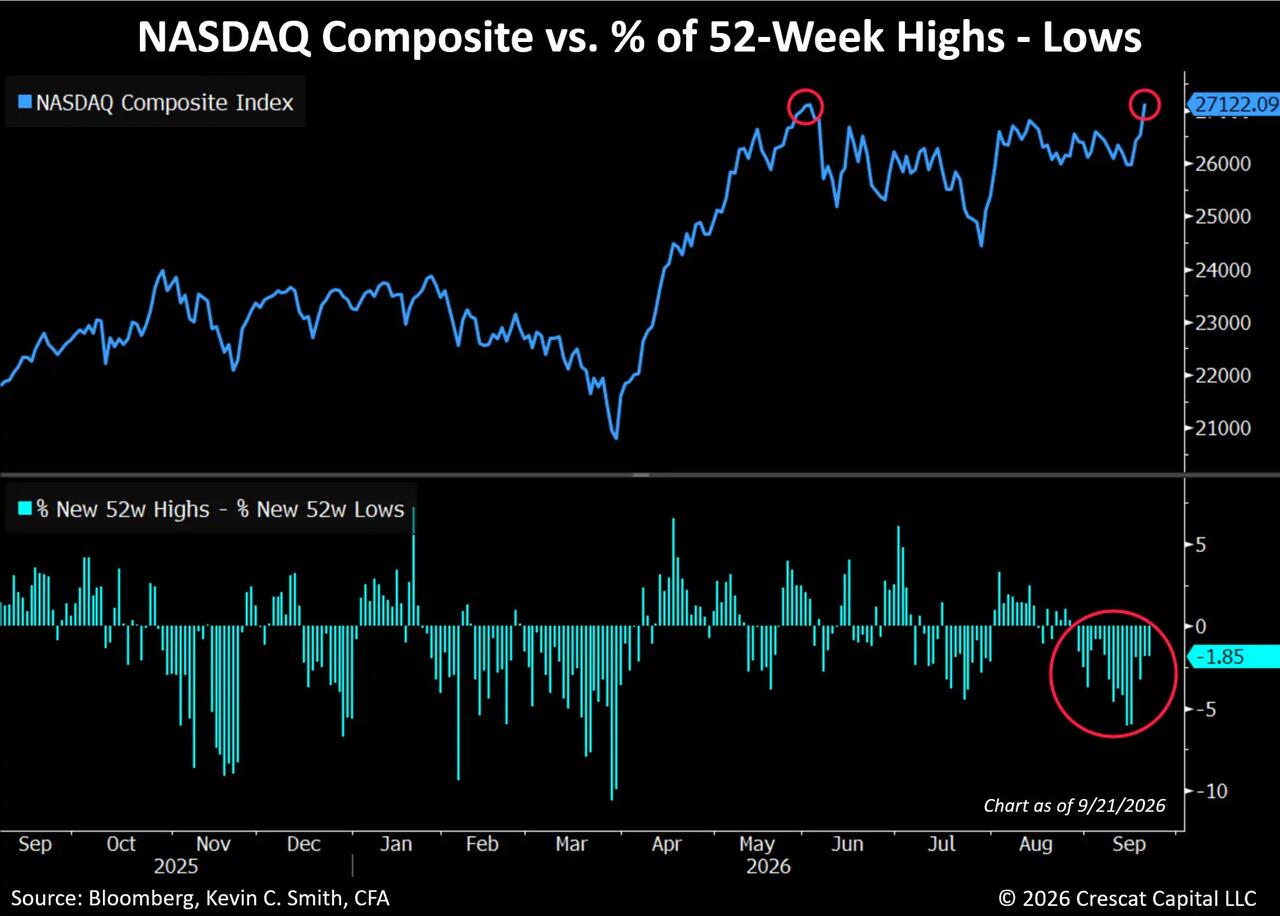
This index just closed at a marginal new all-time high, while the underlying stocks hitting new lows have exceeded those hitting new highs for 17 days straight. Weak, non-confirming market internals can signal a major market top. In this case, a narrow group of large stocks has driven the overall index return to new highs without confirmation from its underlying components.
Widening CCC vs. BBB Credit Spreads
Credit markets are generally quicker to pick up on deteriorating corporate cash flows than equity markets. While the S&P 500 Index has been hitting new all-time highs over the past six months, US triple-C credit spreads relative to triple-B have widened significantly over the same time, another non-confirming divergence, which we show in the chart below.
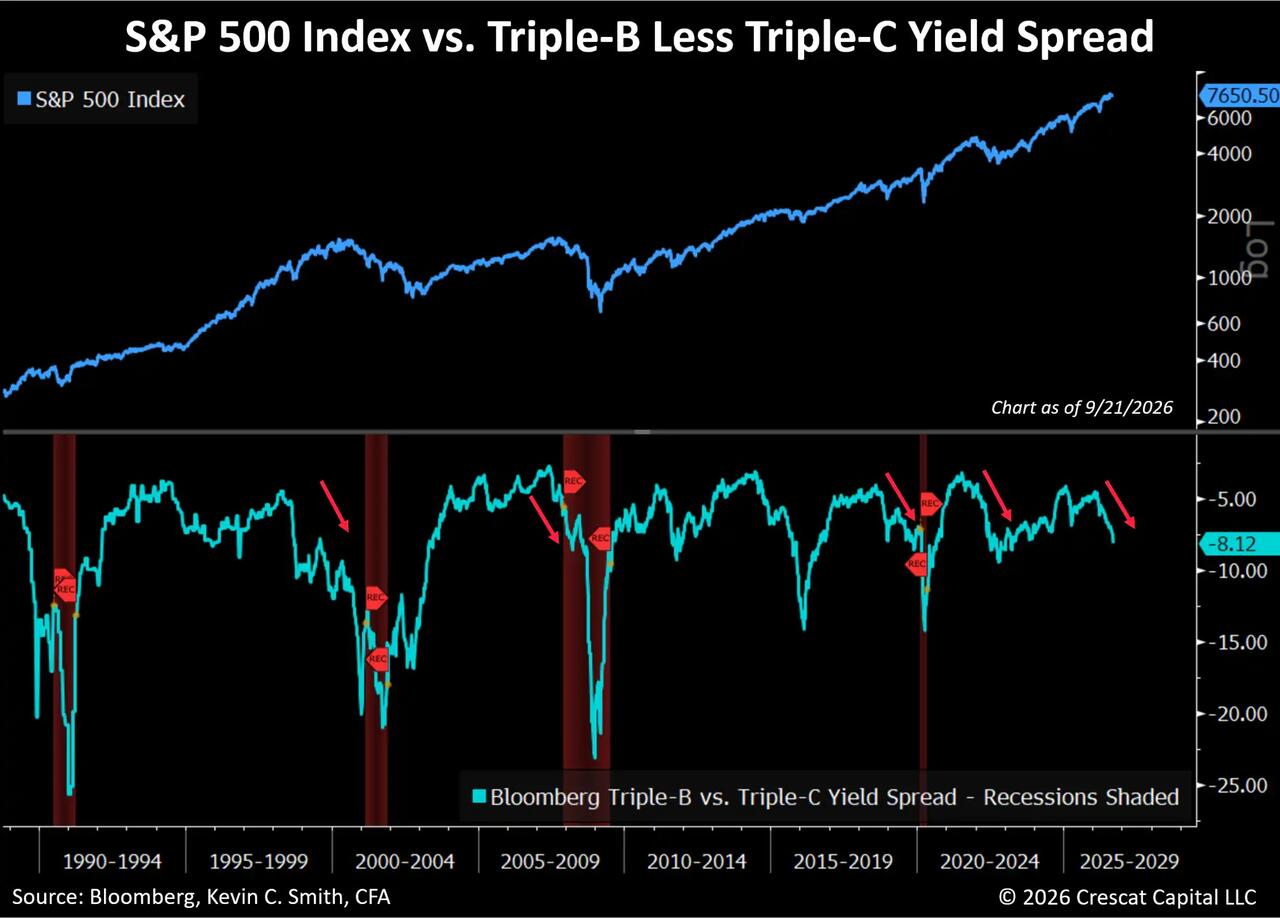
Similar warning signals of a pending stock market downturn from this indicator can be seen in the same chart historically:
Recent Negative Correlation of the Advance-Decline Line vs. S&P 500
The advance-decline line is a plot of the cumulative sum of daily differences between the number of issues advancing and those declining for a given market index. In capitalization-weighted stock indices, such as the S&P 500, price changes of larger market-cap stocks will have larger effects on index returns. The advance-decline line can provide insight regarding the number of individual stocks participating in a market rally or decline.
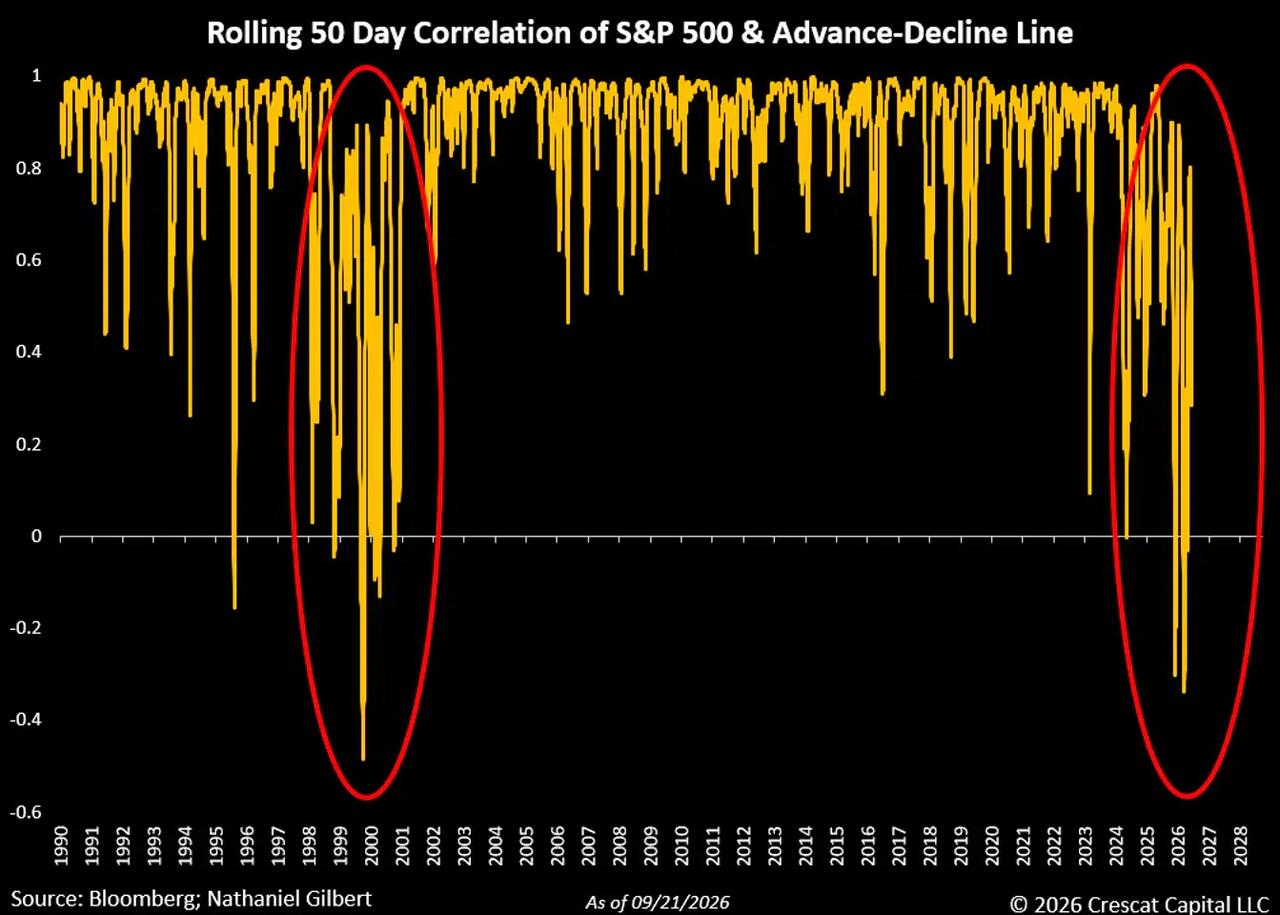
Divergence occurs when the underlying index moves in one direction and the advance-decline line for that index moves in the opposite direction. When the advance-decline line is moving down while the underlying index pushes higher, one begins to question the true health and direction of the market.
Below is a chart showing the rolling 50-day correlation between the S&P 500 and its cumulative advance-decline line. Over 2026, we have seen their relationship weaken substantially and even turn negative. The last time we saw such divergence was during the peak of the Dotcom bubble.
S&P 500 Deterioration of Members Trading Above 200-day Moving Average
The percent of members in the S&P 500 trading above their 200-day averages has plunged over the past month, as we show in the chart below, even as the index itself has remained relatively flat, near all-time highs. This divergence points towards a breakdown in market breadth despite apparent top-line stability. Again, performance is becoming increasingly concentrated among a small group of megacaps.
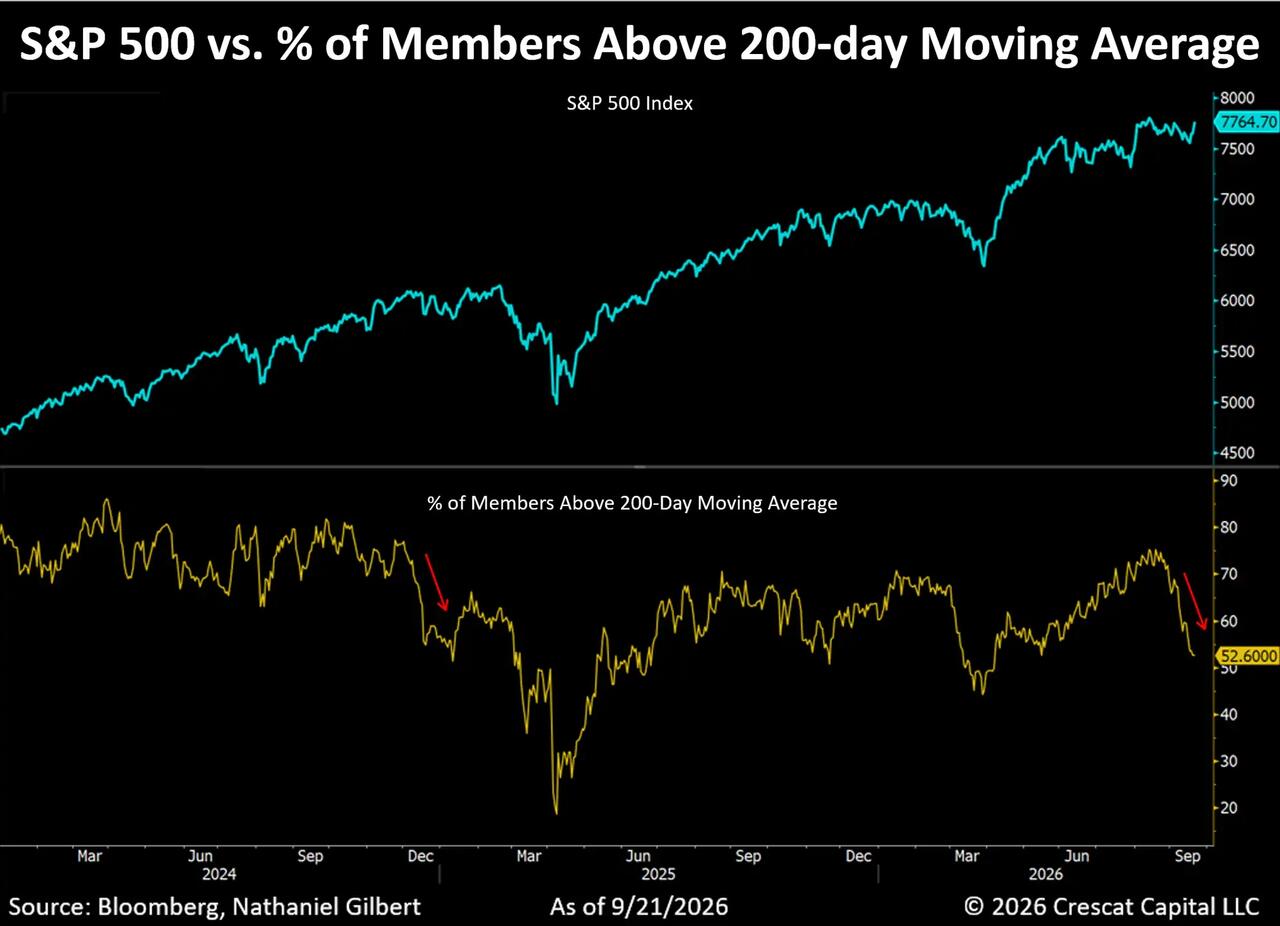
As one can see in the chart, a similar setup emerged in the lead-up to Liberation Day (April 2nd, 2025), where technicals began to weaken before the broad market selloff. Selling pressure and risk reduction were already building beneath the surface ahead of the tariff announcement. The tariff announcement was the spark that lit the fire.
The Perfect Hedge
What do we see as the perfect hedge for today’s stock market? While no hedge is perfect, to us it means positioning for what we believe offers the strongest potential risk-adjusted outperformance, or alpha, relative to the S&P 500.
Today, we believe that opportunity is in gold. More specifically, we see even greater alpha potential in Crescat’s diversified activist precious and critical metals exploration strategy. Junior mining exploration carries operational risks and market volatility, but we believe it offers substantially better value and long-term growth potential than gold itself. That is where our precious metals hedge funds are focused.
Tyler Durden Wed, 09/23/2026 - 12:20
Continue reading...
[ H/T ZeroHedge ]
Via Crescat Capital,
We showed in prior letters that the US stock market has recently reached all-time high valuations across a variety of dimensions. Now, the market is flashing warning signals of a potential major market top based on a variety of divergent technical and cross-market indicators.
We show four of these in this letter:
New 52-week Highs vs. Lows Chart
Normally, when a stock market index moves up and down, the underlying stocks reaching new 52-week highs minus those hitting new 52-week lows go up and down, in sync. One can see that relationship most of the time in the NASDAQ Composite chart below over the last year. Recently, however, it’s been the opposite.
This index just closed at a marginal new all-time high, while the underlying stocks hitting new lows have exceeded those hitting new highs for 17 days straight. Weak, non-confirming market internals can signal a major market top. In this case, a narrow group of large stocks has driven the overall index return to new highs without confirmation from its underlying components.
Widening CCC vs. BBB Credit Spreads
Credit markets are generally quicker to pick up on deteriorating corporate cash flows than equity markets. While the S&P 500 Index has been hitting new all-time highs over the past six months, US triple-C credit spreads relative to triple-B have widened significantly over the same time, another non-confirming divergence, which we show in the chart below.
Similar warning signals of a pending stock market downturn from this indicator can be seen in the same chart historically:
- A divergence in credit spreads vs. the 2000 tech bubble and stock market top;
- Trends and levels consistent with the very beginning of the last two major stock market meltdowns and recessions: the 2008 Global Financial Crisis and the 2020 Covid recession; and
- Deterioration consistent with the 2022 bear market.
Recent Negative Correlation of the Advance-Decline Line vs. S&P 500
The advance-decline line is a plot of the cumulative sum of daily differences between the number of issues advancing and those declining for a given market index. In capitalization-weighted stock indices, such as the S&P 500, price changes of larger market-cap stocks will have larger effects on index returns. The advance-decline line can provide insight regarding the number of individual stocks participating in a market rally or decline.
Divergence occurs when the underlying index moves in one direction and the advance-decline line for that index moves in the opposite direction. When the advance-decline line is moving down while the underlying index pushes higher, one begins to question the true health and direction of the market.
Below is a chart showing the rolling 50-day correlation between the S&P 500 and its cumulative advance-decline line. Over 2026, we have seen their relationship weaken substantially and even turn negative. The last time we saw such divergence was during the peak of the Dotcom bubble.
S&P 500 Deterioration of Members Trading Above 200-day Moving Average
The percent of members in the S&P 500 trading above their 200-day averages has plunged over the past month, as we show in the chart below, even as the index itself has remained relatively flat, near all-time highs. This divergence points towards a breakdown in market breadth despite apparent top-line stability. Again, performance is becoming increasingly concentrated among a small group of megacaps.
As one can see in the chart, a similar setup emerged in the lead-up to Liberation Day (April 2nd, 2025), where technicals began to weaken before the broad market selloff. Selling pressure and risk reduction were already building beneath the surface ahead of the tariff announcement. The tariff announcement was the spark that lit the fire.
The Perfect Hedge
What do we see as the perfect hedge for today’s stock market? While no hedge is perfect, to us it means positioning for what we believe offers the strongest potential risk-adjusted outperformance, or alpha, relative to the S&P 500.
Today, we believe that opportunity is in gold. More specifically, we see even greater alpha potential in Crescat’s diversified activist precious and critical metals exploration strategy. Junior mining exploration carries operational risks and market volatility, but we believe it offers substantially better value and long-term growth potential than gold itself. That is where our precious metals hedge funds are focused.
Tyler Durden Wed, 09/23/2026 - 12:20
Continue reading...
[ H/T ZeroHedge ]