





The Disastrous UK Disability Signal That Corroborates The US Data!
Authored by Ed Dowd: Beyond the Narrative via Substack,
On August 11 I wrote US Disabilities Hit an All-Time High of 37 Million In July: UP 23% Since Feb 2021. The BLS Current Population Survey printed 37,029,000 Americans 16 and over reporting a disability. That is seven million more people since February 2021, a 3-to-4 sigma break from the pre-2020 plateau that has not mean-reverted.
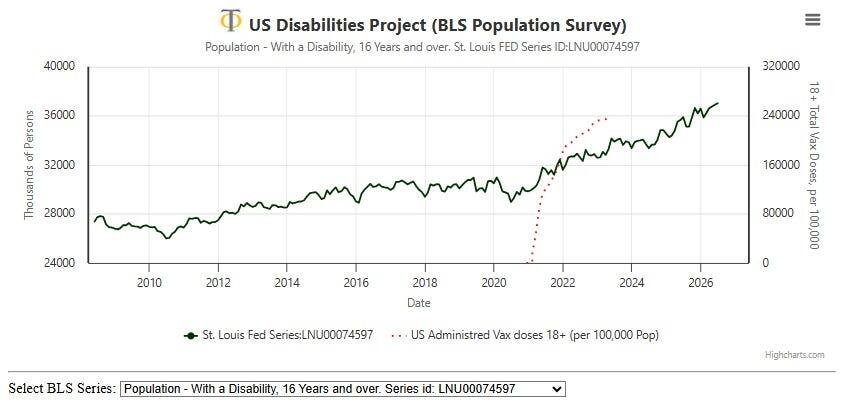
The inflection is February 2021 with the Covid vaccine rollout not in 2020 when Covid was at its most virulent strain. Alternative explanations fail the timing and the magnitude test. The UK PIP system corroborates that US survey signal with something the American series cannot give you: medically assessed new claims broken down by body system and underlying cause.
If you want to know whether that US survey signal is real, stop arguing about survey design and look at an administrative system that actually diagnoses people.
Go back to the UK Disabilities (PIP) Project we published at Phinance Technologies. The page is still up...use it. It was built so researchers, doctors, and ordinary citizens could see the same thing we saw in 2023. You can look at total body system new claims or by underlying cause new claims (best viewed on desktop) within a body system. You can pick absolute new claims, excess new claims, percent excess new claims and excess new claims z score. We also break it out by monthly and yearly data. Finally you can sort it by age group as well. Play with data and be horrified like we were in 2023. Interactive charts...all done by Phinance Technologies for free.
PIP is not the protagonist from Charles Dickens's novel Great Expectations. It is the UK's main working-age disability benefit officially known as the Personal Independence Pension program by the UK Department of Work. Claims are medically assessed. Decisions, "clearances," as noted above are coded by body system and then by underlying cause. The positive award rate has been stable at around 40 percent, so you are not looking at a sudden collapse in standards. You are looking at more people presenting with more illness...new claims, not just the stock of existing claimants, sorted monthly or yearly and by age band versus a 2016-2019 trend.
That is the advantage over the US survey. The BLS series tells you that disability exploded after early 2021 with the vaccine rollout and not in 2020 with the virus. PIP tells you where in the body it exploded, and it lets you watch the timing against the vaccine rollout curve on the same chart.
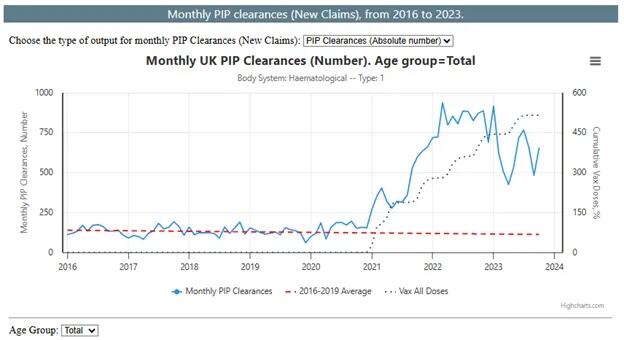
Hematological (blood) disorders went off the rails. New excess clearances rose about 217 percent in 2021 and then 522 percent in 2022 while 2023 declined but still at an absurd 374 percent above trend. Over 300 percent above trend two years running. When looking at new claims on a monthly basis Hematology jumped early and hard almost coincident with the first doses. That is a regime change in medically assessed claims. I have posted those charts more than once on X in 2023. Something broke and the administrative system recorded it at a scale that alone should have produced a public-health investigation...it did not.
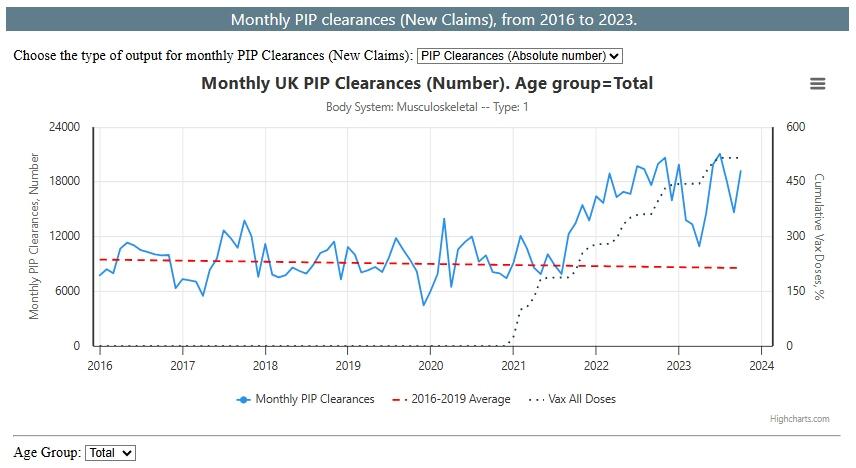
Musculoskeletal claims tell a different, equally inconvenient story. Monthly clearances sat near a "normal" 10,000 through 2020 and early 2021. Then, around September 2021, they jumped and stayed elevated above 18,000 a month. The rise did not arrive with the first lockdowns or the first COVID wave. It arrived after the mass rollout and into the booster period. Inflammation, joint and soft-tissue disease, the conditions that take people out of work and onto daily-living and mobility awards. The timing is not subtle.
Those two systems are not the whole file. Cardiovascular and neurological claims rose. Breast-cancer clearances showed large excesses in 2022 and 2023 with high z-scores. Different latencies, same calendar: the break is 2021, not 2020. That is why the UK file is useful. It is not one blob called "disability." It is a set of body systems with different clocks, all accelerating after the intervention that was supposed to end the emergency.
People will say PIP is being gamed by fraud. Look at the body-system split before you buy that. A fraud wave does not preferentially light up hematology in early 2021 and musculoskeletal in late 2021 while neurological claims print 20 plus-sigma years. An awareness campaign does not move breast-cancer clearances. Two independent disability systems, two countries, both detecting the same inflection period in 2021.
The fiscal piece is already visible in Britain. Claimant counts have roughly doubled since 2019. Psychiatric disorders are now the largest single category. Spending is on a path that forces politicians to talk about "sustainability" and tighter points tests instead of asking why so many working-age bodies failed in the same window. The US version of that conversation is coming. A permanently larger disabled share of the 16-plus US population is lower labor force participation, higher absence, higher insurance cost, and more pressure on SSDI and Medicaid. You can ignore a chart. You cannot ignore the payroll.
I am not a clinician. We said that on the site in 2023 and asked doctors to explain the findings...mostly crickets. The charts are still there. Pick a body system. Pick an age band. Look at the cumulative dose curve. Watch across the many body systems how in 2020 they stay close to trend and then in 2021 they leave the trend. That is the instruction. The US disability series tells you that the population got sicker after February 2021 in the US. The UK PIP file tells you which systems broke and when.
Together they are the corroborating signal no one in official public health circles wants you to see.
The great cover up continues into 2026 and the damage is slowly compounding.
Tyler Durden Thu, 10/01/2026 - 02:00
Continue reading...
[ H/T ZeroHedge ]
Authored by Ed Dowd: Beyond the Narrative via Substack,
The Disability Signal Across the Atlantic
On August 11 I wrote US Disabilities Hit an All-Time High of 37 Million In July: UP 23% Since Feb 2021. The BLS Current Population Survey printed 37,029,000 Americans 16 and over reporting a disability. That is seven million more people since February 2021, a 3-to-4 sigma break from the pre-2020 plateau that has not mean-reverted.
The inflection is February 2021 with the Covid vaccine rollout not in 2020 when Covid was at its most virulent strain. Alternative explanations fail the timing and the magnitude test. The UK PIP system corroborates that US survey signal with something the American series cannot give you: medically assessed new claims broken down by body system and underlying cause.
If you want to know whether that US survey signal is real, stop arguing about survey design and look at an administrative system that actually diagnoses people.
Go back to the UK Disabilities (PIP) Project we published at Phinance Technologies. The page is still up...use it. It was built so researchers, doctors, and ordinary citizens could see the same thing we saw in 2023. You can look at total body system new claims or by underlying cause new claims (best viewed on desktop) within a body system. You can pick absolute new claims, excess new claims, percent excess new claims and excess new claims z score. We also break it out by monthly and yearly data. Finally you can sort it by age group as well. Play with data and be horrified like we were in 2023. Interactive charts...all done by Phinance Technologies for free.
PIP is not the protagonist from Charles Dickens's novel Great Expectations. It is the UK's main working-age disability benefit officially known as the Personal Independence Pension program by the UK Department of Work. Claims are medically assessed. Decisions, "clearances," as noted above are coded by body system and then by underlying cause. The positive award rate has been stable at around 40 percent, so you are not looking at a sudden collapse in standards. You are looking at more people presenting with more illness...new claims, not just the stock of existing claimants, sorted monthly or yearly and by age band versus a 2016-2019 trend.
That is the advantage over the US survey. The BLS series tells you that disability exploded after early 2021 with the vaccine rollout and not in 2020 with the virus. PIP tells you where in the body it exploded, and it lets you watch the timing against the vaccine rollout curve on the same chart.
Two Body Systems Make the Point
Hematological (blood) disorders went off the rails. New excess clearances rose about 217 percent in 2021 and then 522 percent in 2022 while 2023 declined but still at an absurd 374 percent above trend. Over 300 percent above trend two years running. When looking at new claims on a monthly basis Hematology jumped early and hard almost coincident with the first doses. That is a regime change in medically assessed claims. I have posted those charts more than once on X in 2023. Something broke and the administrative system recorded it at a scale that alone should have produced a public-health investigation...it did not.
Musculoskeletal claims tell a different, equally inconvenient story. Monthly clearances sat near a "normal" 10,000 through 2020 and early 2021. Then, around September 2021, they jumped and stayed elevated above 18,000 a month. The rise did not arrive with the first lockdowns or the first COVID wave. It arrived after the mass rollout and into the booster period. Inflammation, joint and soft-tissue disease, the conditions that take people out of work and onto daily-living and mobility awards. The timing is not subtle.
Those two systems are not the whole file. Cardiovascular and neurological claims rose. Breast-cancer clearances showed large excesses in 2022 and 2023 with high z-scores. Different latencies, same calendar: the break is 2021, not 2020. That is why the UK file is useful. It is not one blob called "disability." It is a set of body systems with different clocks, all accelerating after the intervention that was supposed to end the emergency.
People will say PIP is being gamed by fraud. Look at the body-system split before you buy that. A fraud wave does not preferentially light up hematology in early 2021 and musculoskeletal in late 2021 while neurological claims print 20 plus-sigma years. An awareness campaign does not move breast-cancer clearances. Two independent disability systems, two countries, both detecting the same inflection period in 2021.
The fiscal piece is already visible in Britain. Claimant counts have roughly doubled since 2019. Psychiatric disorders are now the largest single category. Spending is on a path that forces politicians to talk about "sustainability" and tighter points tests instead of asking why so many working-age bodies failed in the same window. The US version of that conversation is coming. A permanently larger disabled share of the 16-plus US population is lower labor force participation, higher absence, higher insurance cost, and more pressure on SSDI and Medicaid. You can ignore a chart. You cannot ignore the payroll.
Bottom Line
I am not a clinician. We said that on the site in 2023 and asked doctors to explain the findings...mostly crickets. The charts are still there. Pick a body system. Pick an age band. Look at the cumulative dose curve. Watch across the many body systems how in 2020 they stay close to trend and then in 2021 they leave the trend. That is the instruction. The US disability series tells you that the population got sicker after February 2021 in the US. The UK PIP file tells you which systems broke and when.
Together they are the corroborating signal no one in official public health circles wants you to see.
The great cover up continues into 2026 and the damage is slowly compounding.
Tyler Durden Thu, 10/01/2026 - 02:00
Continue reading...
[ H/T ZeroHedge ]