








Not All Bond Carry Is Created Equal
Authored by Eva Sun-Wai via M&G Investments' Bond Vigilantes,
The word 'carry' is frequently thrown around in fixed income, and you will have heard many uses of it this year in the fashion of 'carry is back' or 'fixed income finally offers income again.' It is a crucial part of an underlying bond's return profile, and it is absolutely 'back,' but the purpose of this blog is to distinguish the important difference between having carry and being protected by carry. Today's starting yields offer an attractive entry point, but if the underlying bond is sufficiently volatile, a relatively modest yield move can erase a year's income quickly. When you factor in carry alongside rolldown and adjust for volatility, however, the 'carry cushion' can look pretty compelling. So rather than looking at bond markets and trying to time the perfect entry point, or simply choosing which bond market yields the most, the more useful question is: 'how wrong can I afford to be?'
The total return for a bond investor is approximately:
We are largely focusing on the first two components, i.e. the return one earns even if yield curves and FX stay the same.
Let's start with bond carry, and whilst closely related to yield, it's important to distinguish the difference:
In practice, for bonds trading close to par, yield and carry are approximately the same number (for simplicity, the examples going forward will assume this). Where they diverge is for bonds trading significantly above or below par: a bond with a 2% coupon trading at a deep discount might have a yield of 6%, but its carry (the actual cash income) is only 2%. The rest of the return comes from the pull-to-par as the bond approaches maturity.
A simple carry cushion answers the question 'how much can yields rise before I breakeven?' and is approximated by annual carry ÷ duration. A bond carrying 6% with 6 years of duration has a cushion of 100 basis points (bps) - yields must rise by a full percentage point before the investor loses money over a one-year horizon. A bond carrying 4.5% with 4 years of duration has a cushion of 112 bps - a lower headline carry, but more protection. Of course, I should caveat the rest of the blog by making it clear that a carry cushion measures the expected breakeven; it says nothing about the worst-case scenario.
The table below shows the breakeven yield rise (in bps) across a range of starting carry levels and durations. Unsurprisingly, the cushion is greatest when starting yields are high and duration is short: higher carry provides more income to offset adverse price moves, while lower duration limits the price sensitivity to a given change in yields. As duration increases, the same rise in yields produces a larger capital loss and therefore requires a greater breakeven to absorb it.
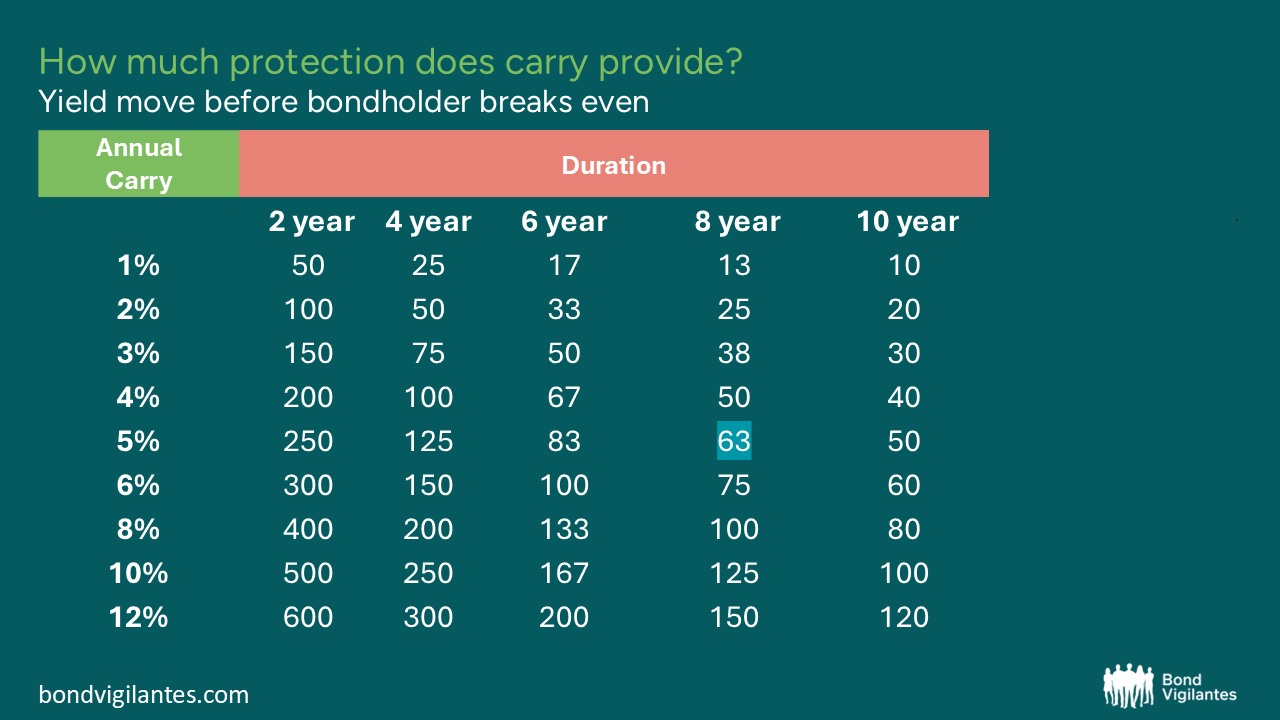
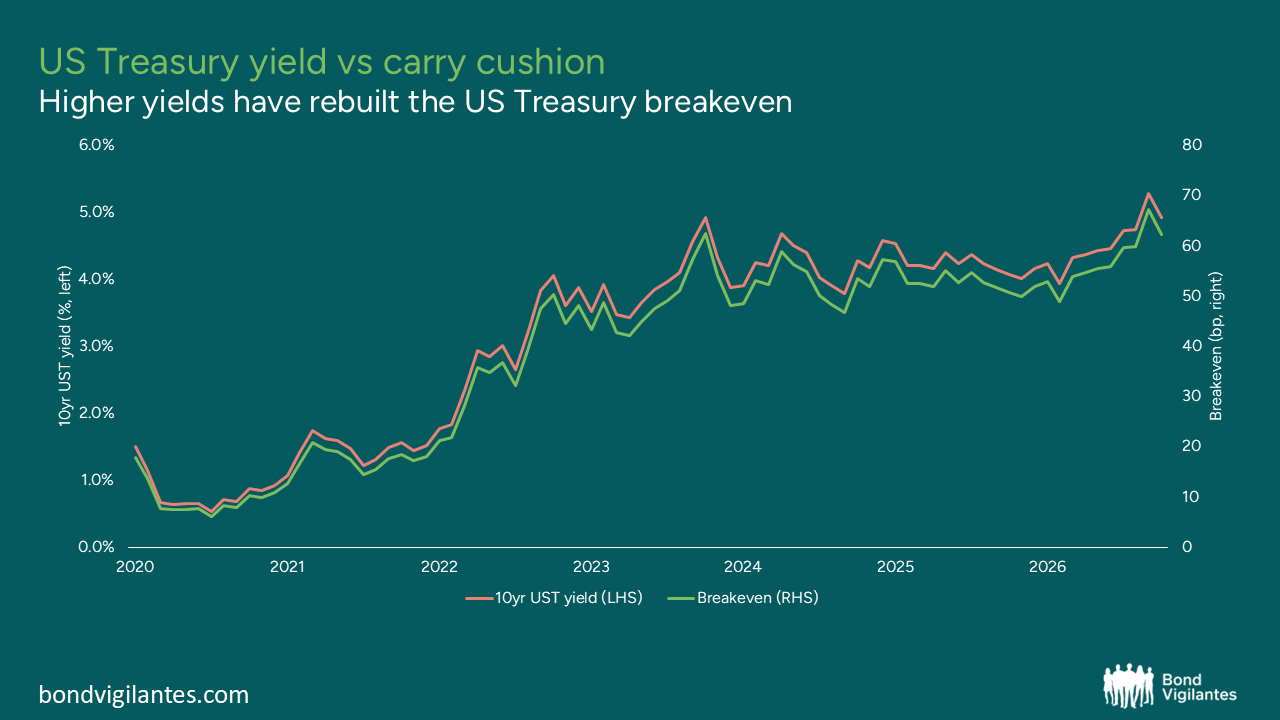
Let's bring this to life via the 10 year US treasury, which has a yield of roughly 5% and about 8 years duration (highlighted on above table). So as it stands, yields can move another 63 bps wider before an investor breaks even. Given this is a bond that trades pretty close to par, we can see a very tight relationship between the yield over time (LHS) and the carry cushion (RHS).
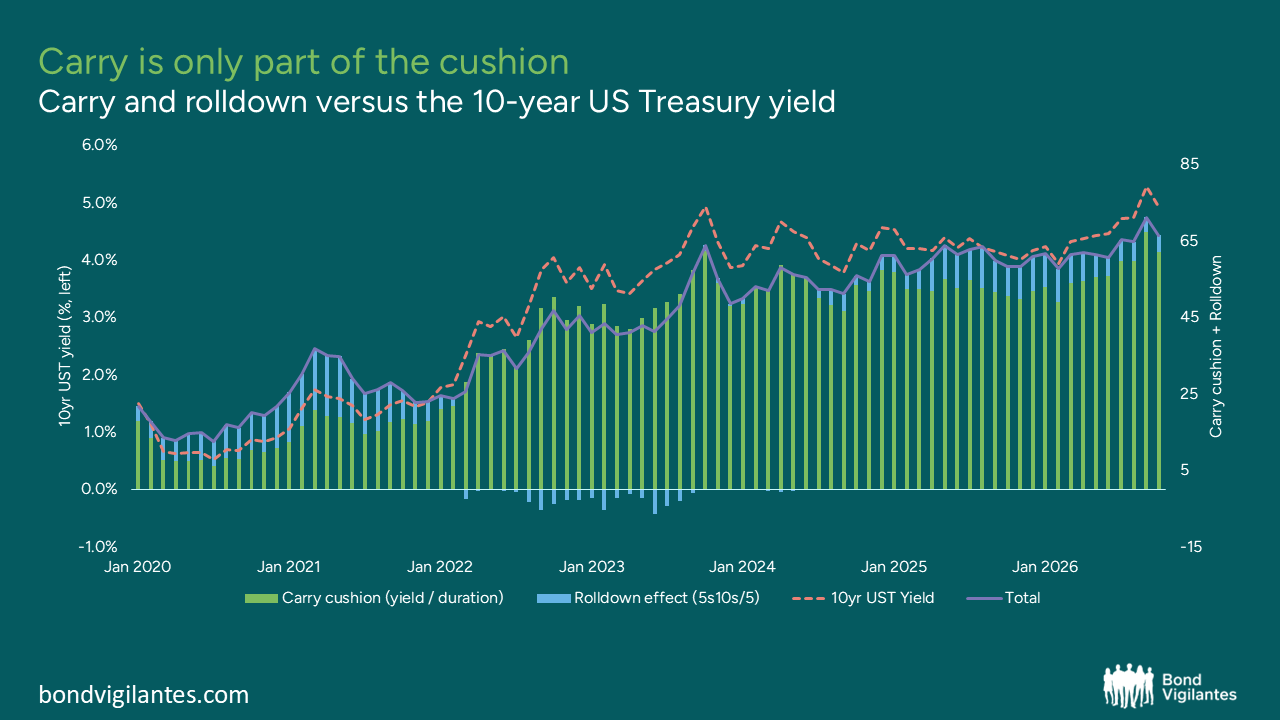
Importantly, this is a pretty simplistic interpretation of whether the 'fixed income' within a bond is actually protecting you. An important part of our earlier formula was also rolldown, i.e. the annual capital gain from aging one year along the curve.
A positive number means the curve is upward sloping, which is in the interest of the investor whilst a negative number suggests the curve is inverted, which works against the investor. To approximate this, I have taken the difference between 5-year and 10 year yields and spread it across the five years between them. Adding this to our carry measure gives us a better sense of the overall cushion available to absorb adverse yield impacts. (please refer to Miles Tym for more sophisticated explanations of roll).
Rolldown: the price change a bond experiences as it moves closer to maturity along a yield curve, assuming the curve remains unchanged.
We can see that in 2020/21, rolldown was doing as much work as carry, but the overall cushion was still a mere ~25bps. Rolldown begins detracting from the cushion through 2022/23 as the curve inverted. As curves re-steepened in 2025 and 2026, we see it become more additive. Given the curve flattening over this year as markets began pricing rate hikes once more, almost all of today's cushion is coming from carry, but the overall number is much healthier.
Ok, so where can we get the healthiest carry efficiency today? Using the 10-year benchmark bond from some key markets, we can produce the matrix below with a little more maths. Note that durations vary as bonds of the same maturity can have different price sensitivities to the same change in interest rates, which affects the cushion. I also wanted to adjust for volatility, as volatility adjusted-carry gives us a much more realistic gauge of one's protection. Using 1 year historical volatility (the annualized standard deviation of daily changes in the 10 year benchmark yield for each country), the resulting volatility adjusted cushion answers the question, if yield volatility over the next year matches the past year, how many standard deviations of movement does the carry absorb?
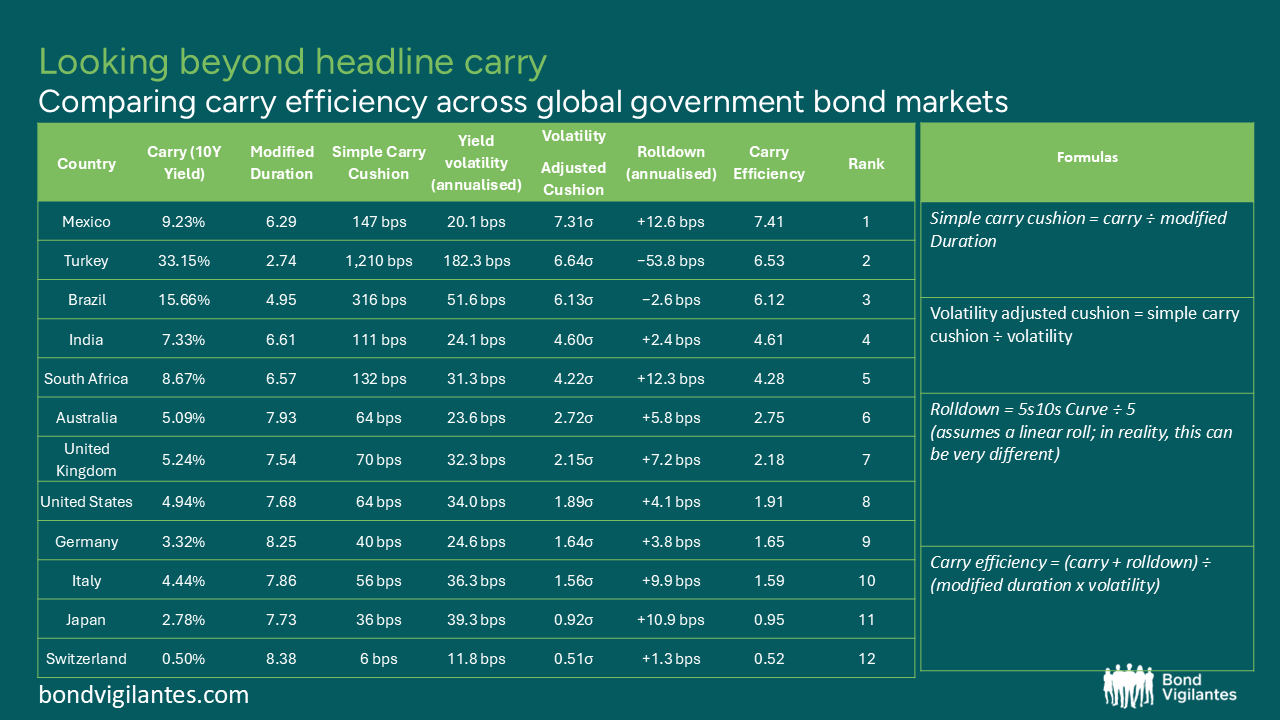
Finally, the overall carry efficiency combines all three dimensions - income, curve shape and volatility -into a single ratio for each 10-year bond. The numerator is the total expected return from time passing (carry plus rolldown). The denominator is a proxy for the risk of being wrong: duration scales the sensitivity to yield moves, and volatility captures how large those moves tend to be. A higher number means more expected return per unit of duration-and-volatility risk. Based on this analysis, Mexico ranks first overall because the combination of moderate-high carry (and thus a bit less duration than the lower yielders), low yield volatility, and a positively sloped curve, all combine to produce the most carry per unit of risk.
Bond investing is often framed as an exercise in forecasting where interest rates will be in six or twelve months. In reality, that is only one source of return. Starting carry, rolldown, curve shape, and relative valuation can all generate returns without requiring a heroic macroeconomic forecast. Instead of asking, 'will yields keep rising?' we are trying to ask 'how far could yields rise before the carry and rolldown are exhausted, and is that a large enough buffer to compensate for the risks?'
As a final reminder, the focus of this blog has been deliberately on the fixed parts of a bond's total return (carry and rolldown) and how large a cushion they provide against adverse moves in yields. But a bond's total return has variable components too: the mark-to-market price move from unexpected yield changes, and, for foreign currency bonds, the movement in the exchange rate. A larger carry cushion offers more protection against these variable drivers: the higher the cushion, the further yields have to move, or the more the currency has to weaken, before the investor loses money.
We have kept the maths deliberately simple here - we could have incorporated FX volatility into the cushion calculation (we have used yield volatility only, which is measured in local currency terms), or we could have shown how much carry survives once you hedge the currency. But that starts to require a rather involved detour into FX forward pricing and swap curves, so perhaps we will save that for another blog. The core conclusion stands regardless: the higher the carry cushion, the more room an investor has to be wrong on the things they cannot control. It just cannot make them immune to those things entirely.
Carry does not protect bond investors from being wrong. But it determines how wrong we are allowed to be before we start losing money - and even though the macroeconomic environment remains uncertain, with compelling starting yields and steep curves in many markets, it may be one of the most useful numbers in fixed income.
Tyler Durden Thu, 11/19/2026 - 15:15
Continue reading...
[ H/T ZeroHedge ]
Authored by Eva Sun-Wai via M&G Investments' Bond Vigilantes,
The word 'carry' is frequently thrown around in fixed income, and you will have heard many uses of it this year in the fashion of 'carry is back' or 'fixed income finally offers income again.' It is a crucial part of an underlying bond's return profile, and it is absolutely 'back,' but the purpose of this blog is to distinguish the important difference between having carry and being protected by carry. Today's starting yields offer an attractive entry point, but if the underlying bond is sufficiently volatile, a relatively modest yield move can erase a year's income quickly. When you factor in carry alongside rolldown and adjust for volatility, however, the 'carry cushion' can look pretty compelling. So rather than looking at bond markets and trying to time the perfect entry point, or simply choosing which bond market yields the most, the more useful question is: 'how wrong can I afford to be?'
The total return for a bond investor is approximately:
We are largely focusing on the first two components, i.e. the return one earns even if yield curves and FX stay the same.
Let's start with bond carry, and whilst closely related to yield, it's important to distinguish the difference:
- Yield is the total annualized return an investor would earn if they bought a bond today and held it to maturity, assuming all coupons are reinvested at the same rate. It is a forward-looking, all-in measure that reflects the bond's price, coupon, and time to maturity.
- Carry is narrower: it is the income a bond generates simply by being held over a given period, without any change in price. For a fixed-rate bond, carry is primarily the coupon income - the cash the bond pays out - accrued over the holding period. If a bond has a 5% annual coupon and you hold it for one year, you earn 5% in carry, regardless of what happens to the bond's price.
In practice, for bonds trading close to par, yield and carry are approximately the same number (for simplicity, the examples going forward will assume this). Where they diverge is for bonds trading significantly above or below par: a bond with a 2% coupon trading at a deep discount might have a yield of 6%, but its carry (the actual cash income) is only 2%. The rest of the return comes from the pull-to-par as the bond approaches maturity.
A simple carry cushion answers the question 'how much can yields rise before I breakeven?' and is approximated by annual carry ÷ duration. A bond carrying 6% with 6 years of duration has a cushion of 100 basis points (bps) - yields must rise by a full percentage point before the investor loses money over a one-year horizon. A bond carrying 4.5% with 4 years of duration has a cushion of 112 bps - a lower headline carry, but more protection. Of course, I should caveat the rest of the blog by making it clear that a carry cushion measures the expected breakeven; it says nothing about the worst-case scenario.
The table below shows the breakeven yield rise (in bps) across a range of starting carry levels and durations. Unsurprisingly, the cushion is greatest when starting yields are high and duration is short: higher carry provides more income to offset adverse price moves, while lower duration limits the price sensitivity to a given change in yields. As duration increases, the same rise in yields produces a larger capital loss and therefore requires a greater breakeven to absorb it.
Let's bring this to life via the 10 year US treasury, which has a yield of roughly 5% and about 8 years duration (highlighted on above table). So as it stands, yields can move another 63 bps wider before an investor breaks even. Given this is a bond that trades pretty close to par, we can see a very tight relationship between the yield over time (LHS) and the carry cushion (RHS).
Importantly, this is a pretty simplistic interpretation of whether the 'fixed income' within a bond is actually protecting you. An important part of our earlier formula was also rolldown, i.e. the annual capital gain from aging one year along the curve.
A positive number means the curve is upward sloping, which is in the interest of the investor whilst a negative number suggests the curve is inverted, which works against the investor. To approximate this, I have taken the difference between 5-year and 10 year yields and spread it across the five years between them. Adding this to our carry measure gives us a better sense of the overall cushion available to absorb adverse yield impacts. (please refer to Miles Tym for more sophisticated explanations of roll).
Rolldown: the price change a bond experiences as it moves closer to maturity along a yield curve, assuming the curve remains unchanged.
We can see that in 2020/21, rolldown was doing as much work as carry, but the overall cushion was still a mere ~25bps. Rolldown begins detracting from the cushion through 2022/23 as the curve inverted. As curves re-steepened in 2025 and 2026, we see it become more additive. Given the curve flattening over this year as markets began pricing rate hikes once more, almost all of today's cushion is coming from carry, but the overall number is much healthier.
Ok, so where can we get the healthiest carry efficiency today? Using the 10-year benchmark bond from some key markets, we can produce the matrix below with a little more maths. Note that durations vary as bonds of the same maturity can have different price sensitivities to the same change in interest rates, which affects the cushion. I also wanted to adjust for volatility, as volatility adjusted-carry gives us a much more realistic gauge of one's protection. Using 1 year historical volatility (the annualized standard deviation of daily changes in the 10 year benchmark yield for each country), the resulting volatility adjusted cushion answers the question, if yield volatility over the next year matches the past year, how many standard deviations of movement does the carry absorb?
Finally, the overall carry efficiency combines all three dimensions - income, curve shape and volatility -into a single ratio for each 10-year bond. The numerator is the total expected return from time passing (carry plus rolldown). The denominator is a proxy for the risk of being wrong: duration scales the sensitivity to yield moves, and volatility captures how large those moves tend to be. A higher number means more expected return per unit of duration-and-volatility risk. Based on this analysis, Mexico ranks first overall because the combination of moderate-high carry (and thus a bit less duration than the lower yielders), low yield volatility, and a positively sloped curve, all combine to produce the most carry per unit of risk.
The point of all of this?
Bond investing is often framed as an exercise in forecasting where interest rates will be in six or twelve months. In reality, that is only one source of return. Starting carry, rolldown, curve shape, and relative valuation can all generate returns without requiring a heroic macroeconomic forecast. Instead of asking, 'will yields keep rising?' we are trying to ask 'how far could yields rise before the carry and rolldown are exhausted, and is that a large enough buffer to compensate for the risks?'
As a final reminder, the focus of this blog has been deliberately on the fixed parts of a bond's total return (carry and rolldown) and how large a cushion they provide against adverse moves in yields. But a bond's total return has variable components too: the mark-to-market price move from unexpected yield changes, and, for foreign currency bonds, the movement in the exchange rate. A larger carry cushion offers more protection against these variable drivers: the higher the cushion, the further yields have to move, or the more the currency has to weaken, before the investor loses money.
We have kept the maths deliberately simple here - we could have incorporated FX volatility into the cushion calculation (we have used yield volatility only, which is measured in local currency terms), or we could have shown how much carry survives once you hedge the currency. But that starts to require a rather involved detour into FX forward pricing and swap curves, so perhaps we will save that for another blog. The core conclusion stands regardless: the higher the carry cushion, the more room an investor has to be wrong on the things they cannot control. It just cannot make them immune to those things entirely.
Carry does not protect bond investors from being wrong. But it determines how wrong we are allowed to be before we start losing money - and even though the macroeconomic environment remains uncertain, with compelling starting yields and steep curves in many markets, it may be one of the most useful numbers in fixed income.
Tyler Durden Thu, 11/19/2026 - 15:15
Continue reading...
[ H/T ZeroHedge ]